1. Introduction
Mobile money is described as a ‘A Bank in Your Pocket’ explaining it as electronic financial services performed using a mobile phone
| [6] | Asongu, S., & Odhiambo, N. (2022). The role of mobile characteristics on mobile money innovations. Quality & Quantity, 56(6), 4693–4710. |
[6]
. Mobile payments allow customers to use their electronic accounts (mobile wallet) where electronic money is on a client’s SIM card and secured with a Personal Identification Number (PIN) to make payments to merchants, shops, or stores using their phones.
Mobile money is different from mobile banking, where bank customers access their accounts through mobile phones. The key salient feature of mobile money is that customers only transact through MNOs and are not required to have an account with any financial institution
| [6] | Asongu, S., & Odhiambo, N. (2022). The role of mobile characteristics on mobile money innovations. Quality & Quantity, 56(6), 4693–4710. |
[6]
. It can enhance security by reducing costs, increase transparency through digital accounting and therefore lower the probability of fraud, and can provide an entry point into the formal financial systems.
The proliferation of mobile phones even in rural areas and increased demand for fast, secure, easy, convenient, accessible, affordable, offline, and unbanked money transfer platforms is behind the evolution of digital financial services such as mobile money
| [31] | Nyimbiri, B. A. (2021). The Impact of the Mobile Money on People’s Use of Financial Services in Sub-Sahara Africa. Management Dynamics in the Knowledge Economy, 9(1), 137–146. https://doi.org/10.2478/mdke-2021-0010 |
[31]
. This is similar to the findings of Kelly & Palaniappan in their study on using a technology acceptance model to determine factors influencing the continued usage of mobile money service transactions in Ghana
| [20] | Kelly, A. E., & Palaniappan, S. (2023). Using a technology acceptance model to determine factors influencing continued usage of mobile money service transactions in Ghana. Journal of Innovation and Entrepreneurship, 12(1), 34. |
[20]
. They defined mobile money as a digital financial service that allows users to store, send, and receive money using Application Programming Interfaces (APIs) or digital payment gateways. The study found that mobile money is an easy financial transaction platform for both formal and informal sectors as it utilises a USSD (Unstructured Supplementary Service Data) code to access, store or send money even when using feature phones. This study similarly represents the manner in which digital transactions are conducted in Uganda where digital payment gateways such as PayPal, Pesapal, and Interswitch integrate mobile money with banking. This facilitates e-commerce and payments including electricity bills and prepayments for UEDCL (formerly Umeme), NWSC bills, and school fees payments (School Pay) among other digital transactions. For example, there is no need to visit UEDCL offices or a bank to purchase Yaka (renamed to ‘Light’) tokens for electricity. Instead, by simply dialing a USSD code on an MTN or Airtel number and correctly following the instructions prescribed, a transaction can conveniently be concluded using self-service. Therefore, it can be argued that easy, safe, and reliable digital payment systems can boost economic growth since there are savings from the would-be transport costs and time.
Mobile money was launched in Uganda in 2009 by MNOs such as Mobile Telephone Network (MTN), and later the technology was adopted by other companies such as Airtel in 2012
| [16] | Félix F., S., & Muehlschlegel, T. (2023). Mobile Money, Perception about Cash, and Financial Inclusion: Learning from Uganda’s Micro-Level Data (WP/23/238). |
[16]
. It was ex-ante impossible to transfer money between MTN, Airtel, or other networks. For example, it was not possible to send money from MTN to Airtel and vice versa which could cause significant inconvenience as the individual must have had two lines independently to facilitate transactions. In 2018, interoperability was introduced. As a result, mobile money users increased, for example, MTN Mobile Money (MTN MoMo) user base grew by 13.2%, reaching 13.2 million users
| [27] | MTN. (2024). MTN Uganda Limited Salient features: (Number September). |
[27]
. Additionally, transaction volumes increased by 25.1%, with a total of 3 billion transactions valued at Shs.114.5 trillion. These statistics portray the role of mobile money, a digital finance tool that could significantly contribute to Uganda’s economic growth by adding to the country’s tax base.
The MoFPED report indicates that 81 per cent (20 million) of Uganda’s adults have access to financial services both formally and informally. Additionally, 68 per cent (16.7 million) of Ugandan adults have taken up formal financial services to some extent driven by mobile money services. The widespread adoption of formal financial services promotes a cashless economy, increasing transaction efficiency and reducing the risks associated with cash handling
| [23] | Lissah, J., Kirobo, A., & Govella, M. M. (2022). Adoption of Cashless Economy in the World: A Review. IOSR Journal of Economics and Finance, 13(2), 37–48.
https://doi.org/10.9790/5933-1302083748 |
[23]
. Despite a transition to a cashless society that is already happening all over the world, there is reluctance among the high echelons of power especially in Africa to shift to a complete cashless economy as it decentralises the economic power from their hands
. However, some factors work in the opposite direction as Arvidsson highlighted that it is imprudent to completely adopt a cashless economy though the study was conducted in Sweden which is a developed world unlike Uganda. He argued that there are specific groups in society like the elderly and people with physical and/or cognitive disabilities who prefer cash transactions. Therefore, they are likely to suffer from a reduction in cash usage. Additionally, he posits that there are geographical regions with unreliable telecommunication systems and internet access prompting merchants to prefer cash. The findings concluded by advocating for a movement that strives to keep cash to help these groups, which would act to strengthen the position of cash in Swedish society.
The UBOS
report shows the revised estimates of Uganda’s Gross Domestic Product (GDP) in which the economy grew by 6.1% during the Fiscal year (FY) 2023/24 compared to a growth of 5.3% in 2022/23. The size of the economy in nominal terms increased to UGX 202,725 billion in 2023/24 from 183,004 billion in 2022/2023. In terms of contribution to the GDP, the services sector where mobile money falls continued to be the biggest contributor to the Gross Domestic Product with a share of 43.1% in 2023/2024 compared to 42.5% in 2022/2023. However mobile money contribution is not explicitly shown. Uganda is one of the pioneer mobile money revolution countries in Africa and has registered a steady growth in the penetration of mobile money since its inception in 2009
. As a result, for instance, the value of mobile money transactions accounted for 94 per cent of GDP in 2021, one of the highest penetration rates in Africa.
Mobile money adoption in Uganda has been a profound green finance approach, serving as a key enabler in advancing Uganda’s National Financial Inclusion Strategy (2023–2028)
. The strategy aims to reduce financial exclusion and access barriers to formal financial services through increasing interoperability of mobile money services across networks. It also envisages promotion of mobile money lending products that are accessible and affordable, particularly for rural populations with limited access to traditional banking services. Moreover, the current study also includes two rural districts of Butambala and Bugiri. Similarly, mobile money adoption aligns with global financial inclusion efforts, responding to the G20 Summit of 2017
, which strongly endorsed digital approaches to financial inclusion and Maya Declaration of 2011
, when 80 regulatory institutions from 76 countries individually committed to promoting financial inclusion. Notably, mobile money has partly transformed the lives of several poor consumers who can hold recorded cash privately in non-bank electronic accounts and perform financial transfers easily and cost-effectively
| [31] | Nyimbiri, B. A. (2021). The Impact of the Mobile Money on People’s Use of Financial Services in Sub-Sahara Africa. Management Dynamics in the Knowledge Economy, 9(1), 137–146. https://doi.org/10.2478/mdke-2021-0010 |
[31]
.
Mobile money business is changing the dynamics of business operations where customers with huge capital can become master agents and super agents. Many people including graduates and those with basic education or no education background are mobile money agents and their life has not remained the same. To maximise economic growth, policies should focus on enhancing digital literacy, providing business skills training, and expanding financial services to reach more people, especially in rural areas
| [33] | Puspita, I. (2024). Impact of Digital Literacy Programs on Information Access in Rural African Communities in Indonesia. African Journal of Information and Knowledge Management, 2(1), 13–26. https://doi.org/10.47604/ajikm.2266 |
[33]
. For instance, the number of mobile money agents in Uganda grew from 212,517 in 2019 to 667,172 by the end of 2023
| [41] | UCC. (2023). Annual Communications Sector Report 2023 Towards an Inclusive Digital Economy. |
[41]
. The expansion of mobile money agent network has been paramount in ensuring service accessibility, particularly in rural and underserved areas as well as bridging the financial access services gap
| [32] | Osabutey, E. L. C., & Jackson, T. (2024). Mobile money and financial inclusion in Africa: Emerging themes, challenges and policy implications. Technological Forecasting and Social Change, 202(May), 123339.
https://doi.org/10.1016/j.techfore.2024.123339 |
[32]
. Thus, the primary reason many individuals have entered the mobile money business over other ventures is its convenience for both entrepreneurs and customers. Advantageously, the service is accessible on both feature phones and smartphones, making it widely inclusive
| [28] | Muchandigona, A. K., & Kalema, B. M. (2023). Mobile Phone-Based Money as a Tool for Financial Inclusion in Developing Countries: A Review. SSRN Electronic Journal, (January).
https://doi.org/10.2139/ssrn.4331717 |
[28]
. Additionally, the required start-up capital is relatively low, allowing prospective agent entrepreneurs to start the business even from a veranda, home, or small sheltered space. Moreover, the business offers a flexible entry point, as the individual without sufficient capital to obtain a registered business account can operate through a proxy account. Hence the role of mobile money cannot be underrated in promoting economic growth in Uganda.
As of December 2023, cash-in and cash-out digital transactions remained prevalent in the e-money landscape with a notable surge observed in the transaction volumes of Person-to-Person (P2P) transfers, which reached 132.7 million transactions from 88.5 million in December 2022
| [12] | Bank of Uganda. (2023). The Republic of Uganda National Financial Inclusion Strategy. (November), 1–100. |
[12]
. Similarly, person-to-business transactions saw a considerable increase to 323.5 million in December 2023 from 203.2 million in the period ending December 2022. For the first time in history, Uganda met the requirement to graduate from the category of Least Developed Countries (LDCs) in March 2024
| [42] | UN. (2024). Briefing Note On Uganda’s Journey to Graduating from the United Nations Least Developed Country Category. |
[42]
. The UN confirmed this development for purposes of re-categorising Uganda as a developing country in 2027
| [42] | UN. (2024). Briefing Note On Uganda’s Journey to Graduating from the United Nations Least Developed Country Category. |
[42]
. In such developments, digital finance could be partly attributed to this.
The introduction of digital finance services such as mobile money has promoted the saving culture of the people in the money economy
| [29] | Nagaaba, N., Batamuriza, R., Basuta, J., & Owomugisha, M. (2025a). Conceptualizing digital finance as a precursor for financial inclusion and financial service usage in Uganda. Cogent Business and Management, 12(1).
https://doi.org/10.1080/23311975.2024.2448285 |
[29]
. Savings as a share of GDP marginally increased in the last five years, rising from 19.1 per cent in 2018 to 19.3 per cent in FY2022/23 and surpassing the NDPIII target of 18.57 per cent
| [26] | MFPED. (2024). Minister of Finance, Planning and Economic Development. (June), 54–58. |
[26]
. The report asserts that this is partly attributed to a rise in per capita income; and higher utilisation of formal saving mechanisms by households. Similarly, there has been a rise in the use of mobile money as an alternative means of saving, shifting away from traditional home-based safe boxes
| [4] | Arinze, E. D., Uchechukwu, A. J., & Nnachi, A. B. (2024). Mobile Money Adoption in Uganda International Digital Organization for Scientific Research Mobile Money Adoption in Uganda. (October).
https://doi.org/10.59298/JCAS/2024/92.1016 |
[4]
. This trend aligns with Uganda’s National Development Plan III (NDP III) and supports government programs such as the Parish Development Model (PDM) framework, which promotes the use of mobile wallets for financial transactions and savings
| [12] | Bank of Uganda. (2023). The Republic of Uganda National Financial Inclusion Strategy. (November), 1–100. |
[12]
.
Digital finance has significantly contributed to economic growth in Uganda
| [29] | Nagaaba, N., Batamuriza, R., Basuta, J., & Owomugisha, M. (2025a). Conceptualizing digital finance as a precursor for financial inclusion and financial service usage in Uganda. Cogent Business and Management, 12(1).
https://doi.org/10.1080/23311975.2024.2448285 |
[29]
. Globally, the growth of digital technologies in the financial sector has attracted significant academic attention. The proliferation of digital technologies has provided an avenue for developing economies to integrate the unbanked and underbanked populations into the formal financial scheme
| [1] | Adelaja, A. O., Umeorah, S. C., Abikoye, B. E., & Nezianya, M. C. (2024). Advancing financial inclusion through fintech: Solutions for unbanked and underbanked populations. World Journal of Advanced Research and Reviews, 23(01), 427–438. |
[1]
. The perpetual change in customer preferences has stimulated telecom companies to develop innovative and efficient models for transferring money
| [25] | Mehrotra, A., & Menon, S. (2021). Telecommunication networking changing customer profile preferences. In Proceedings of 2nd International Conference on Computation, Automation and Knowledge Management, ICCAKM 2021 (Number January 2021).
https://doi.org/10.1109/ICCAKM50778.2021.9357766 |
[25]
. The introduction of mobile banking, micro-insurance, and microcredit services is changing the outlook and terrain of the financial sector. For instance, in Uganda, telecom companies such as MTN offer health insurance covers through aYo and clinicPesa platforms integrated with mobile money. Using the client’s mobile money transaction records, the clinicPesa platform (accessed by pressing a USSD code *165*44#) computes a credit score and automatically offers a suitable micro-loan when users are paying a bill larger than the amount they have saved. You cannot withdraw money from your mobile account saved for clinicPesa unless you insert the merchant code of the clinic or hospital.
Clients can subscribe on their mobile money accounts and in times of unexpected crises such as accidents they can withdraw money from their accounts to recover from the tragedy. In the African context, the manifestation of financial inclusion is realized in terms of accessibility, affordability, quality, and capability
. Despite the existing literature giving much attention to digital finance and its contribution to financial inclusion, limited research has been conducted to analyse the contribution of digital finance to economic growth, particularly in Uganda’s context which is the major focal point for this study. Therefore, it is imperative to bring new insights into digital finance and economic growth as the two variables continue to be inseparable in this digital age characterised by the automation of systems and limited for traditional banking infrastructure.
2. Materials and Methods
The study was premised on pragmatism as its guiding research philosophy. Pragmatism can combine both positivist and interpretivism positions within the scope of single research according to the nature of the research question
| [14] | Collis, J., & Hussey, R. (2014). Identifying your paradigm. In Business Research (pp. 42–57). Springer. |
[14]
.
The study employed a mixed methods design that included survey, descriptive, exploratory, and correlational designs involving both quantitative and qualitative data. Survey questionnaires were developed to collect quantitative data from a wider geographical coverage within the four selected districts. Descriptive statistics were used to describe phenomena without manipulating variables on mobile money. Exploratory design was used to gain a deeper understanding of concepts in the study variables such as blockchain technology, agent banking, and others particularly in the context of how they contribute to economic growth, notion that was not captured in UBOS annual statistical reports. Lastly, a correlational design was employed to establish the relationship between mobile money and economic growth. Quantitative research is a kind of study that explains phenomena by gathering or collecting numerical data which are analysed through mathematical methods inclusive of integration of statistics to arrive at meaningful conclusions
| [3] | Akcam, B. K., Guney, S., & Cresswell, A. M. (2019). Research design and major issues in developing dynamic theories by secondary analysis of qualitative data. Systems, 7(3), 40. |
[3]
.
On the contrary, Qualitative research entails a straightforward and comprehensive fashion that involves a study of human experiences about others and/or oneself in social action and reflexive states
| [22] | L. Haven, T., & Van Grootel, D. L. (2019). Preregistering qualitative research. Accountability in Research, 26(3), 229–244. |
[22]
. Despite being largely a quantitative study (since larger macroeconomic data were collected), the study triangulated with qualitative data specifically on the objective that required more in-depth analysis and insights from respondents particularly key informants such as from Bank of Uganda.
The study population was based on the stakeholders of mobile money as evidenced from Bank of Uganda’s and UBOS Annual reports that were used in this study
with large populations of mobile money users and other stakeholders. The units of inquiry included staff from Bank of Uganda and UCC (which are the main regulators of mobile money services); Commercial banks since they offer mobile banking services; Mobile Telecommunication companies such as MTN and Airtel since they provide mobile money services since they had strong experience and potential to explain the challenges experienced in mobile money usage. The study included schools, supermarkets, fuel stations, hospitals/health centres. The study concentrated on accountants or controllers of fintech apps such as school pay, Momo Pay among others but not the wider community such as parents and fuel station customers, to avoid an extremely huge sample. As such, the units of analysis were commercial banks, telecom companies, regulators, and businesses that use mobile money.
The study target sample was 385 respondents and included 10 policy makers, 60 agent banking staff (15 per district), 40 bank staff (10 per district), 25 fintech companies’ staff were targeted, 5 per company, and 5 companies were targeted to participate in the study as well as 10 Telecom company staff (including 5 per company in two companies-MTN and Airtel Uganda). There were also 160 Mobile Money agents (40 per district) and 80 fintech users as part of the sample (20 per district) since they are key users of digital finance specifically mobile money. 336 (87.3%) were reached during the study. Their benefits, challenges, and recommendations were captured to inform the impact of mobile money as well as policy recommendations from the study.
Where:
N- Sample Size
e-Desired level of precision or confidence, the margin of error at 95% confidence interval
P- The fraction of the Population (as a percentage) that displays the attributes
Z=The z-value extracted from the Z-Table
This study employed simple random sampling and purposive sampling since it allows all elements of the population to have an equal and independent chance of being included in the sample and there may not be a need to know the true composition of the population in context. Simple random sampling eases the assembling of a sample and is considered a fair way of selecting a sample from a given population since every member is given an equal opportunity to be selected to participate in a study
| [34] | Sharma, G. (2017). Pros and cons of different sampling techniques. International Journal of Applied Research, 3(7), 749–752. |
[34]
. Simple random sampling was mainly applied on fintech end users so as to permit every mobile money user an opportunity to be part of the study sample.
On the other hand, purposive sampling is a technique to choose a sample based on specific considerations that lead to information-rich responses
| [13] | Campbell, S., Greenwood, M., Prior, S., Shearer, T., Walkem, K., Young, S., Bywaters, D., & Walker, K. (2020). Purposive sampling: complex or simple? Research case examples. Journal of Research in Nursing, 25(8), 652–661. |
[13]
. As such, purposive sampling was used since the respondents were users of mobile money with an understanding or extensive knowledge of how it may influence economic growth in Uganda. Purposive sampling was also used on BoU staff since they are the regulators and have clear knowledge and experience about the policy regulations, trend, challenges, and future prospects of mobile money in Uganda. Similarly, there was stratified sampling to classify respondents based on their characteristics such as mobile money agents, agent bankers, telecom/mobile money service providers, commercial banks, fintech apps entrepreneurs, and fintech end-users.
The sample was selected from commercial banks, fintech companies/apps and mobile telecommunication companies that use digital financial technology, all from the selected districts. Participants/respondents were randomly selected including agent bankers for the various banks found within the study area (GKMA), departmental heads or bank staff working in the digital finance sections, and staff of the most popular telecom companies in Uganda that use digital financial technology.
Both primary and secondary data sources were used. Primary data were collected to obtain update, reliable, and accurate facts directly from the respondents with knowledge and experience of mobile money and economic growth in Uganda.
Secondary data were collected since there was need to compare primary data from the field with data from other reports, journals, or previous sources. Further, macro-economic statistics could easily be reliably collected mainly from secondary data such as annual reports from UBOS
.
During data collection, various data collection methods and procedures were used. To gather data on the impact of Mobile Money Usage on employment generation in Uganda, both primary and secondary data were used. Primary data were collected using questionnaire method and hence a structured questionnaire (which was the research instrument) was used on mobile money agents and fintech end-users to gain deeper insights on mobile money usage in Uganda. Secondary data on mobile money usage in Uganda, especially from reports of the Bank of Uganda (BoU), the World Bank, Uganda Communications Commission, the Uganda Bureau of Statistics, the Ministry of Finance, Planning & Economic Development (MoFPED) and reports from telecom companies (MTN and Airtel Uganda), were collected using documentary review and content analysis. At the initial stage, 4 data collection assistants (research assistants) were hired to support data collection in one out of the 4 districts. These had a one-day training to get acquainted with the data collection instruments in this study and ethical considerations during data collection. An introductory letter was obtained from Ndejje University Graduate School (PhD Coordinator) for introduction to the target respondents to allow data collection. The research assistants in the 4 districts were deployed concurrently to save time. They provided daily updates including submitting completed scanned/pdf questionnaires and interview data. For documentary review/secondary data, more data were collected from various sources as prescribed earlier to enrich the study.
Data quality control involves undertaking steps/measures to ensure the validity, reliability, precision, integrity, and promptness of data
| [18] | Hochkamp, F., & Rabe, M. (2022). Outlier detection in data mining: Exclusion of errors or loss of information? Changing Tides: The New Role of Resilience and Sustainability in Logistics and Supply Chain Management–Innovative Approaches for the Shift to a New Era. Proceedings of the Hamburg International Conference of Logistics (HICL), Vol. 33, 91–117. |
[18]
. Both validity and reliability of the tools were tested. Data validity occurs in the sense that the individual scores of an instrument are meaningful and permit the researcher to draw appropriate conclusions from the sample being studied
| [15] | Creswell, J. W., & Poth, C. N. (2016). Qualitative inquiry and research design: Choosing among five approaches. Sage publications. |
[15]
. Validity can also be defined as the extent to which the scores from a measure represent the variable, they are intended to
| [24] | Liu, Y., Weng, X., Wan, J., Yue, X., Song, H., & Vasilakos, A. V. (2017). Exploring data validity in transportation systems for smart cities. IEEE Communications Magazine, 55(5), 26–33. |
[24]
. This study largely considered the content validity index to ensure that the content captured by the data collection instruments/tools is relevant to generate appropriate responses. A content validity index (CVI) of 0.877 and reliability of 0.79. CVI should be between 0 to 1
| [21] | Kovacic, D. (2018). Using the content validity index to determine content validity of an instrument assessing health care providers’ general knowledge of human trafficking. Journal of Human Trafficking, 4(4), 327–335. |
[21]
. The closer to 1, the higher the validity of the items evaluated.
Statistical Package for Social Scientists (SPSS) version 30 was used to analyse data specifically using numerical coding, multiple regression, logistic regression measurement, and analysis of the correlation between mobile money and economic growth. The data were presented in the form of tables, graphs, pie charts, and other figures with narrative explanations provided to ease readability, interpretation, and conclusions. In the analysis, descriptive statistics including mean and standard deviation were used to generate and analyse average responses from the respondents and the overall interpretation. Inferential statistics specifically correlational analysis, multiple regression, and logistical regression were also employed throughout the analysis.
Qualitative data was analysed used thematic analysis based on each objective of the study and separately presented. Interpretation and attachment of meaning to descriptive data were based on the mean responses between 1.00-5.00 where 1.00-1.79 implied strongly disagree or very weak, 1.80-2.59 -disagree or weak, 2.60-3.39-moderate or neutral response, 3.40-4.19 interpreted as agree or high, and 4.20-5.0 was interpreted as strongly agree. For the inferential results, Pearson Correlation coefficients were analysed and interpreted as: 0.00-No relationship at all, 0.01-019-very weak relationship, 0.20-0.39-weak relationship, 0.40-0.59-Moderate, 0.60-0.79-strong relationship, and 0.80-1.00-very strong relationship. The relationship was either positive or negative. The closer the value of R (in %) to 1, the stronger the relationship and contribution of mobile money to economic growth. For the multiple regression analysis, interpretation was based on P-values such that the closer to zero, the stronger the significance of the predictor (mobile money) to economic growth.
In terms of ethical considerations, the study followed research ethics guidelines provided for by Ndejje University Graduate School and the Uganda National Council of Science and Technology (UNCST). While the study was limited to four districts, the use of robust secondary macroeconomic data from UBOS and BoU allows for generalizable conclusions.
3. Results
Demographic/ Socioeconomic Characteristics of the Respondents
The respondents were asked to share their demographics. These variables establish the profile of the respondent, crucial for segmentation of the data and understanding which groups are using digital finance. The findings on the gender of the respondents were summarised in
Table 1 below:
Table 1. Gender of the Respondents.
Respondents’ Data | Attributes | Frequency | Percentage |
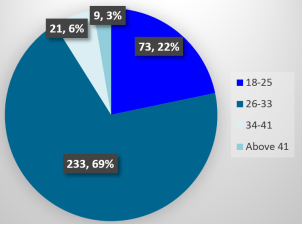
Gender of the Respondents | Male | 219 | 65.2% |
Female | 117 | 34.8% |
Total | | 336 | 100 |
Source: Primary Data, 2025
The gender distribution of digital finance users revealed a significant disparity, with males constituting 65.2% of respondents compared to females at 34.8%. This implies that digital finance adoption in Uganda is skewed toward males, possibly due to socio-economic factors such as higher male participation in formal employment, greater access to mobile technology, or cultural norms influencing financial decision-making. The findings align with broader Sub-Saharan African trends where men often dominate financial transactions. However, the 34.8% female representation indicates progress in financial inclusion, driven by mobile money platforms that cater to informal sector workers, where women are prominent.
Age of the respondents
Figure 1. Age of the Respondents.
The age distribution (
Figure 1) indicates dominance by tech-savvy younger demographics, while the educational profile (
Figure 2) confirms accessibility even for users with limited formal schooling.
Respondents were predominantly from Kampala (45.8%) and Wakiso (29.2%), urban centres with robust digital infrastructure, while rural districts like Bugiri (11%) and Butambala (14%) had lower representation. This urban-rural divide highlights the role of infrastructure in digital finance penetration. Urban areas benefit from better network coverage, higher internet access, and greater awareness of digital services. The lower adoption in rural regions may stem from limited connectivity, lower literacy rates, or reliance on cash-based economies.
Level of Education
Figure 2. Level of Education of the Respondents.
Table 2. Employment Status of the Respondents.
Employment Status | Number | Percentage |
Employed | 194 | 57.70% |
Unemployed | 6 | 1.80% |
Self employed | 136 | 40.50% |
Total | 336 | 100.00% |
Source: Primary Data, 2025
In terms of employment, self-employment (40.5%) and formal employment (57.7%) were dominant, with minimal unemployment (1.8%). This reflects digital finance’s role in supporting entrepreneurial activities and salary disbursements. The high self-employment rate aligns with Uganda’s informal economy, where mobile money enables small business transactions.
Digital Finance Usage
These are variables that directly relate to the respondents’ interaction, history, and specifics of using digital financial services and related technologies. These are part of the core of the study, detailing how, when, and where digital financial services are being utilized. These include;
Table 3. Nature of Business.
Nature of Business | Number | Percentage |
School | 26 | 7.7% |
Health Centre | 14 | 4.2% |
Fuel station | 46 | 13.7% |
Restaurant/Hotel | 15 | 4.5% |
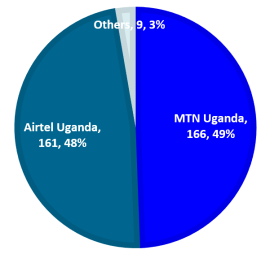
Agent Banking | 69 | 20.5% |
Mobile Money Agent | 166 | 49.4% |
Total | 336 | 100 |
Source: Primary Data, 2025
In terms of nature of business, mobile money agents (49.4%) and agent banking (20.5%) dominated, indicating that digital finance is heavily driven by intermediary services. Sectors like schools (7.7%) and health centres (4.2%) showed lower engagement, suggesting lower levels of digital finance in education and healthcare sectors in Uganda. Notably, the schools and health centres that were visited effectively and frequently used digital finance platforms including school pay, merchant codes, agent banking, and direct payments with mobile money. The predominance of mobile money agents aligns with Uganda’s thriving informal sector, where such services facilitate cashless transactions for underserved populations.
Ownership of Mobile Phones
Figure 3. Ownership of Mobile Phones.
All the respondents sampled had mobile phones (100%), confirming that mobile phones are the primary enabler of digital finance. This explains the potential for scaling mobile-based financial services across all demographics in Uganda.
Table 4. Nature of Digital Finance Used.
Nature of Digital Finance | Number | Percentage |
Mobile Money | 281 | 83.6% |
School Pay Platform | 16 | 4.8% |
Visa card/Mastercard/Credit Card | 25 | 7.4% |
Mobile Banking | 6 | 1.8% |
Cryptocurrency | 8 | 2.4% |
Total | 336 | 100 |
Source: Primary Data, 2025
Mobile money was the most popular form of digital finance with 83.6% of the respondents using it, the most popular, far outpacing cards (7.4%), school pay platform (4.8%), and mobile banking (1.8%). This dominance explains mobile money’s accessibility and suitability for Uganda’s cash-heavy economy. Cryptocurrency (2.4%) usage, though increasing, signals growing interest in alternative finance. However, the usage of crypto currency is not legally permitted in Uganda as Bank of Uganda has no policy or law guiding crypto transactions, rendering it risky to customers.
Table 5. Frequency in Using Digital Finance services.
Frequency | Number | Percentage |
Very Rarely | 4 | 1.2% |
Rarely | 3 | 0.9% |
Not much/moderately | 20 | 6.0% |
Often | 129 | 38.4% |
Very Often | 180 | 53.6% |
Total | 336 | 100 |
Source: Primary Data, 2025
Most of the users of digital finance agreed that they often engaged in digital finance transactions (92.0%) indicating high dependency on digital finance for daily transactions. Rare users (1.2%) represent those with limited trust or access to digital finance services. Majority of these agreed that it was mobile money services, merchant codes, ATM withdrawal services, online payment for utilities, among others, that formed the daily transactions for which digital finance was required.
Year of starting Usage of Digital Finance Services
It was found that 74.1% adopted digital finance usage between 2010-2015, coinciding with period in which mobile money was introduced and expanded in Uganda. However, there were others (11.3%) who adopted digital finance before 2010 particularly using services such as MoneyGram, Western Union, and other similar services. 9.8% adopted digital finance between 2016-2021 and only 4.8% in the post 2021 period.
Figure 4. Year of Starting Digital Finance Usage.
Telecom Company Used for Mobile Money Services
Figure 5. Telecom Company Used for Mobile Money Services.
Most of the respondents used MTN (49.4%) and others Airtel (47.9%) as the main telecom service providers, reflecting their huge market penetration and large geographical coverage in Uganda. This partly explains competition between these service providers drives innovation and affordability in digital finance services especially mobile money.
Utilities /Services Paid Using Digital Finance Services
Table 6. Utilities /Services Paid Using Digital Finance Services.
Utility Type | Number | Percentage |
School fees | 113 | 33.6% |
Water | 68 | 20.2% |
Electricity | 137 | 40.8% |
TV subscription | 10 | 3.0% |
Fuel | 5 | 1.5% |
Others | 3 | 0.9% |
Total | 336 | 100.0% |
Source: Primary Data, 2025
For the key services and utilities paid for, with digital finance services, electricity (40.8%) and school fees (33.6%) were found to be the top uses, demonstrating digital finance’s role in access to essential services in Uganda. Low usage for fuel (1.5%) suggests limited usage in some sectors. However, fuel is mainly demanded by those with motor vehicles, and a smaller percentage of the population in Uganda, have their own vehicles save for drivers who only refuel vehicles that do not belong to them.
Table 7. Other purposes for which Digital Finance Services are used.
Service Type | Number | Percentage |
Online Shopping | 9 | 2.7% |
Saving | 20 | 6.0% |
Sending and Receiving Money | 228 | 67.9% |
Loan/credit acquisition and payment | 51 | 15.2% |
Investment | 13 | 3.9% |
Insurance | 11 | 3.3% |
Others | 4 | 1.2% |
Total | 336 | 100.0% |
Source: Primary Data, 2025
Majority of respondents (67.9%) used digital finance services mainly for sending and receiving money as the primary use and international money transfers (remittances). Only 2.7% used digital finance for online shopping, an indicator of lower levels of e-commerce in Uganda.
Access to internet
In terms of access to internet, only 42.9% had internet access against 57.1% who did not access internet, revealing a major barrier to advanced digital finance services such as mobile banking and internet banking.
Figure 6. Access to Internet.
Table 8. Whether internet is needed for digital financial services.
Need for Internet | Number | Percentage |
Yes | 165 | 49.1% |
No | 171 | 50.9% |
Total | 336 | 100.0% |
Source: Primary Data, 2025
A near-even split in which 49.1% of the respondents needed internet to access digital finance services against 50.9% who argued they never needed internet for digital finance services. The findings emphasize the reliance on mobile money as the main form of digital finance services and largely depends on USSD codes in operation which do not require internet to operate.
Attitudinal/ Perception Variables
These capture the respondents’ opinions, feelings, and intentions regarding digital finance services. These measure the users’ subjective experience and future behaviour which is critical for service improvement and forecasting growth. These include;
Table 9. Convenience of Digital Finance Services.
Level of Convenience | Number | Percentage |
Very Inconvenient | 34 | 10.1% |
Inconvenient | 20 | 6.0% |
Fair | 27 | 8.0% |
Convenient | 173 | 51.5% |
Very Convenient | 82 | 24.4% |
Total | 336 | 100.0% |
Source: Primary Data, 2025
Most of the users (75.9%) found digital finance convenient validating its user-friendliness. This was mainly explained in terms of its speed in sending and receiving money as well as receiving transaction statements using mobile phones.
Table 10. Possibility of Recommending other companies / institutions/peers to use digital transactions.
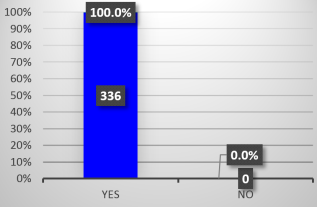
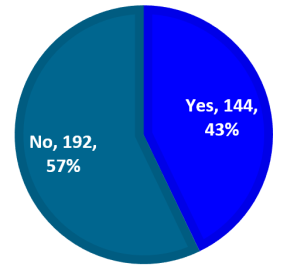
Response | Number | Percentage |
Yes | 329 | 97.9% |
No | 7 | 2.1% |
Totals | 336 | 100 |
Source: Primary Data, 2025
97.9% of the respondents would recommend digital finance, indicating high satisfaction and trust. This advocacy is crucial for its growth and wider adoption. However, with mobile money being the largest form of digital finance used in the country as per the findings, other forms of digital finance are less used and hence undermining the potential of enjoying a variety of digital finance services in the country.
Correlation Between Mobile Money Usage and Economic Growth
The results for the correlation between mobile money and economic growth were shown in
Table 11 below:
Table 11. Correlation Results between Mobile money usage and Economic Growth.
| | Mobile Money | Economic Growth |
Mobile Money Usage | Pearson Correlation | 1.00 | .79** |
Sig. (2-tailed) | | .001 |
N | 336 | 336 |
Economic Growth | Pearson Correlation | .79** | 1.00 |
| Sig. (2-tailed) | .001 | |
| N | 336 | 336 |
**. Correlation is significant at the 0.05 level (2-tailed) |
Source: Primary Data, 2025
The results of the Pearson correlation analysis reveal a strong positive and statistically significant relationship between mobile money usage and economic growth. Specifically, the Pearson correlation coefficient (r) is 0.79, indicating a strong positive correlation. This means that a directional change in mobile money usage will lead to the same directional change in economic growth.
As the usage of mobile money usage increases through activities such as facilitating transactions, enabling savings, and improving access to financial services, there is a corresponding improvement or increase in economic growth. The relationship is statistically significant at the 0.01 level (2-tailed), with a p-value of 0.001, which is below the standard alpha threshold of 0.01.
Regression Results:
Table 12. Model Summary for Mobile Money Usage and Economic Growth.
Model | R | R Square | Adjusted R Square | Std. Error of the Estimate |
1 | 0.480 | 0.230 | 0.228 | 0.737 |
a. Predictors: (Constant), Mobile Money Usage |
Source: Primary Data, 2025
The value of R is 0.480, and the coefficient of determination (R²) is 0.230, which confirms that mobile money usage has a statistical effect on economic growth. Results indicate that mobile money usage explains approximately 23.0% of the variance in economic growth, and 77.0% of the variation is attributable to other factors not captured in this model. The results highlight the importance of mobile money usage in influencing economic growth.
Table 13. ANOVA Statistics of Mobile Money Usage and Economic Growth.
ANOVAa |
Model | Sum of Squares | df | Mean Square | F | Sig. |
1 | Regression | 23.461 | 1 | 23.461 | 42.812 | .001b |
Residual | 183.032 | 334 | 0.548 | | |
Total | 206.492 | 335 | | | |
a. Dependent Variable: Economic Growth |
b. Predictors: (Constant), Mobile Money Usage |
Source: Primary Data, 2025
The ANOVA statistic was found to be significant (F = (1, 334) which is 42.812 and p < 0.05), which implies that the regression model adopted was statistically significant and can be relied upon to make further inferences.
Table 14. Coefficient Results of Mobile Money Usage and Economic Growth.
Coefficientsa |
Model | Unstandardized Coefficients | Standardized Coefficients | t | Sig. |
B | Std. Error | Beta |
1 | (Constant) | 3.105 | 0.23 | | 38.869 | 0.001 |
Mobile Money Usage | 0.339 | 0.024 | 0.48 | 14.125 | 0.001 |
a. Dependent Variable: Economic Growth |
Source: Primary Data, 2025
The above results indicate that the beta coefficient of 0.48 was recorded for mobile money usage, which signifies the strength and direction of the relationship between mobile money usage and economic growth in the context of the study. Results show that a unit change in mobile money usage would result in a 0.339 change in economic growth, with the unstandardized coefficient (B) indicating that for every one-unit increase in mobile money usage, economic growth increases by 0.339 units, holding other factors constant. The finding was also significant at the 99% confidence level (p = 0.001) which is below the alpha threshold of 0.01, indicating that mobile money usage has a statistically significant positive relationship with economic growth. Hence, the study rejects the null hypothesis that “Mobile Money Usage has no significant impact on Economic Growth”.
Regression Model
Y =1 + 1X1 (Mobile Money Usage), which is further expressed as:
EconomicGrowth=3.105+0.339(MobileMoneyUsage)
4. Discussion
Below is the discussion of findings on the impact of mobile money on economic growth.
On whether the respondents used mobile money to receive funds, the high mean score of 4.10 indicates strong agreement among respondents. This finding is positively supported by the literature that details how mobile money platforms like MTN MoMo and Airtel Money in Uganda have created a major channel for remittances, allowing the diaspora to send money directly to mobile wallets via services like WorldRemit
| [6] | Asongu, S., & Odhiambo, N. (2022). The role of mobile characteristics on mobile money innovations. Quality & Quantity, 56(6), 4693–4710. |
[6]
. This aligns with the concept of M-Pesa in Kenya, which was launched with the slogan “send money home”. Similarly, the interoperability introduced in Uganda’s mobile money ecosystem in 2018, despite initial setbacks, has significantly enhanced the convenience of receiving funds across different networks
| [16] | Félix F., S., & Muehlschlegel, T. (2023). Mobile Money, Perception about Cash, and Financial Inclusion: Learning from Uganda’s Micro-Level Data (WP/23/238). |
[16]
.
With a mean of 3.99, most of the respondents agreed that they used mobile money for borrowing. This explains the integration of micro-lending products like MTN’s MoKash, and Airtel Weewole, which offer amounts between UGX 3,000 and UGX 1,000,000 at 9% interest per month
| [27] | MTN. (2024). MTN Uganda Limited Salient features: (Number September). |
[27]
. This service is designed explicitly for unbanked and underserved populations, enabling small businesses and individuals to access credit for income-generating activities. The agreement in the findings validates the Uganda government’s National Financial Inclusion Strategy (2023-2028).
The mean response of 3.89 indicates agreement that mobile money is used for storing money, positioning it as a digital savings tool. This is directly attributed to the rise in Uganda’s national savings as a share of GDP from 19.1% to 19.3% partly due to the higher utilisation of formal saving mechanisms, including mobile money
| [29] | Nagaaba, N., Batamuriza, R., Basuta, J., & Owomugisha, M. (2025a). Conceptualizing digital finance as a precursor for financial inclusion and financial service usage in Uganda. Cogent Business and Management, 12(1).
https://doi.org/10.1080/23311975.2024.2448285 |
[29]
. As such, mobile money was viewed as a secure electronic wallet on a client’s SIM card, secured by a PIN, which promotes safety compared to cash.
It was noted that there were still people keeping or hiding money in secret places including at their homes with 45.4% in rural and 31.5% in urban centres. This was partly due to fear of incurring bank charges, mobile money withdrawal charges, and high levels of digital finance illiteracy. The 2024 census report indicated that few customers saved with mobile money compared to commercial banks in rural and urban centres as well as across both genders.
On whether mobile money was the preferred channel for airtime top-ups, majority of the respondents agreed with this (Mean=4.92).
The mean of 2.82 indicates a neutral response towards using mobile money for tax payments, making it moderately used for this purpose. Few respondents used mobile money in paying taxes only that there are already embedded taxes charged on mobile money transactions specifically withdrawals and transfers. Thus, high taxes on small electronic transactions discourage mobile money usage and incentivise a reversion to cash.
The mean response of 2.29 indicates that majority of the respondents did not use mobile money for health insurance payments especially in rural areas. This risk-aversion towards financial commitments via mobile platforms extends to insurance products, which were perceived as a discretionary expense rather than a necessity, especially among low-income populations who prioritize immediate needs over future, uncertain health risks
| [6] | Asongu, S., & Odhiambo, N. (2022). The role of mobile characteristics on mobile money innovations. Quality & Quantity, 56(6), 4693–4710. |
[6]
.
As regards whether mobile money facilitates financial monitoring and expenditure tracking, majority of the respondents agreed (Mean =4.03). Digital payments including mobile money are “traceable,” creating a digital ledger of transactions. This automatic record-keeping is a key benefit, allowing users to review their transaction history. This enhances personal financial management and transparency. These platforms are designed for accountability. For instance, the clinicPesa platform does not allow withdrawals unless a specific code is inserted
| [27] | MTN. (2024). MTN Uganda Limited Salient features: (Number September). |
[27]
, enforcing a form of targeted expenditure tracking.
Majority of the respondents perceived mobile money as a source of employment creation, specifically through the agent network (Mean=4.70). The growth in mobile money agent numbers from 212,517 in 2019 to 667,172 by the end of 2023
| [41] | UCC. (2023). Annual Communications Sector Report 2023 Towards an Inclusive Digital Economy. |
[41]
, further agrees with the findings from the field. This has improved service accessibility, particularly in rural areas, thereby bridging the financial access gap while simultaneously creating livelihoods.
With a mean response of 4.03, majority of the respondents agreed that mobile money generally promotes a cashless economy. The widespread adoption of formal financial services, driven by mobile money, promotes a cashless economy, increasing transaction efficiency and reducing the risks associated with cash handling cash
| [26] | MFPED. (2024). Minister of Finance, Planning and Economic Development. (June), 54–58. |
[26]
. Generally, the mobile money usage was high and, on the increase
, similar to the study field findings.